Engagement & Retention project | Zobaze
Retention is an output - of how we activate, engage, and resurrect our users.

Contents of this section:


What is Zobaze's Core value proposition?
Zobaze helps SME business owners take full control of their operations by providing real-time visibility into sales, profits, and cash flow. It also replaces manual tasks, such as traditional pen-and-paper methods for managing store operations, saving them time & helping them organize their business more efficiently.
How does the user experience the core value proposition?
Users can make sales using the Zobaze POS app, which generates receipts that can be printed or shared. Their sales and stock data are transformed into comprehensive reports, providing valuable insights.
In this way, users experience the core value proposition of the product, gaining real-time visibility into their business operations, seamless sales processes, and the ability to make informed decisions that save time and money.
Who is an active user for Zobaze?
Someone who engages with a product's core value prop in certain time period.
An active Zobaze user is someone who makes sales per week.
What is the Natural frequency?
Number of times a user interacts with your product over a period of time
The Zobaze POS app is used daily for making sales. Power users engage with the app throughout the day. The fact that our users have spent over 2.5 billion hours in our app - approx. 29,000 years - demonstrates its frequent and valuable use.
User | Natural Frequency |
|---|---|
Casual User | 2 times a week |
Core User | 4 times a week |
Power User | Daily |
What challenge is Zobaze facing currently?
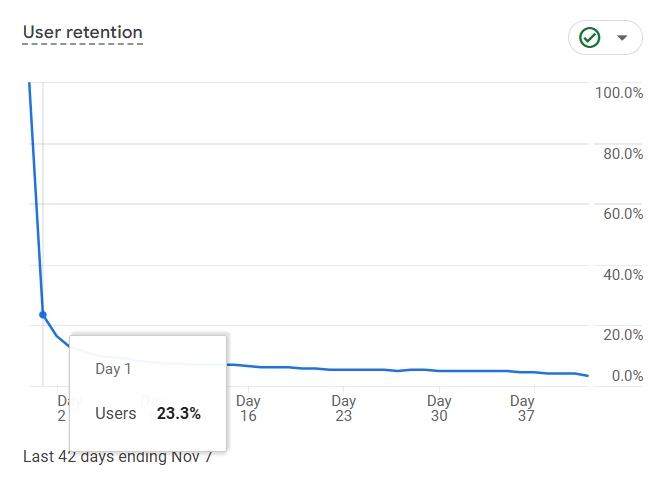
Our current challenge is a low retention rate compared to our total user base. While the users who do retain (power users) engage daily and show exponential growth in their activity, their numbers are quite small. In fact, 76% of the users drop off before Day 1.


Observation: Power users, who recognize the app's value, return daily, while inactivated users tend to drop off before they experience the app's core value.
Solution: The onboarding flow, detailed in the onboarding project, helps in activating the users.
Users who cross this stage themselves understand the value of our product - activated users - are becoming power users. These users engage daily, interact with multiple features, and use them in depth.
While, Casual and core users, on the other hand, engage with very few features regardless of how frequently they're using our product.
So, Zobaze should prioritize on BREADTH engagement framework to encourage users to explore all features & hook them to the product.
- Frequency - Increasing how often users engage with the product.
- Depth - Enhancing how effectively users utilize core features of the product.
- Breadth - Encouraging users to explore and adopt additional features of the product.
Actions that make someone an active user
A comprehensive definition of an active user is: someone who repeatedly performs a key action that directly aligns with our core value proposition.
For a SaaS platform on a freemium model, an active user is someone who performs a core action within a specific time frame.
For Zobaze, to put it simply, users who make sales per week are active users.
User | Actions performed | Active or not | Reason |
|---|---|---|---|
Premium plan | Made daily sales, checked reports frequently, and updated inventory weekly. | Active | Engaged with both sales & analytics tools. |
Free plan | Made 3+ sales per week for the past month and reviewed reports regularly. | Active | Though in free plan, user engaging actively in a weekly basis. |
Premium plan | Added inventory, logs in occasionally to check inventory updates, never makes sales & checks reports. | Not active | Key features aligning to the Core value are not performed. |
Core Engagement Metrics
Now that we've defined our core value proposition and identified the key features that align with it, we can determine that an active user is someone who uses these key features within a specific time period (weekly, in our case), it's time to define those Core Metrics.
These metrics serve as our "North Star", helping us develop strategies that lead users to these goals and eliminate blockers in their way.
Example: Let's say we've identified active user as someone who generates "M" MRR, "A" ARR, renews subscription regularly, spends "T" amount of time everyday on the app, generates "R" number of receipts, and views reports "V" times a day. Every campaign & strategy we create should be designed to help all users achieve these metrics.
Note: Each department may interpret these metrics differently based on their JTBD. Ex, Marketing focuses on DAU/MAU, CS on +ve vs. -ve reviews, and Tech on app crash rates, all aligned with user engagement & business goals.
Team | Key tracking metrics | Why |
|---|---|---|
Product | Active users | To assess number of users performing core actions |
| Engagement Frequency | How often are users engaging with key features. |
Retention Rate | To find % of users continue using the same way. | |
Churn Rate | To know % of users dropping. | |
App Crashes | More number of crashes leads to unpleasant experiences. | |
Feature Adoption Rate | To assess users' interest in new features. | |
Finance | Subscription Renewals | Important to notice % increase or decrease |
Monthly Recurring Revenue | To understand the m-o-m growth | |
Annual Recurring Revenue | y-o-y growth | |
Marketing | Conversion Rate (FTP) | To change the value communication accordingly |
Customer Acquisition Cost | To ensure a decent CAC: LTV ratio | |
Store listing performance | To know the acquisition effectiveness | |
Customer Life Time Value | To ensure a decent CAC: LTV ratio | |
Customer Support | Positive vs. Negative reviews | For the first hand insights |
Customer complaints raised | For the first hand insights | |
Customer satisfaction score | For the first hand insights |
Let's welcome our ICP

Note: All data has been collected through direct user calls - conversations with active users who have been using Zobaze POS for over three years - and validated via surveys with insights from 260+ users.
As far as the Engagement and Retention are concerned, it's crucial to understand the behavior traits of each ICP, not just their basic differences.

Criteria | ICP1 | ICP2 | ICP3 |
|---|---|---|---|
Name | Vivek | Daniel | Sekhar |
Age | 30 | 35 | 35 |
Location | Tier 1 & Tier 2 cities | Tier 1 & Tier 2 cities | Tier 2 city |
Tech Literate | High | Moderate | High |
Business Type | Retail + Wholesale | Retail | Restaurant |
No. of Staff | 2 | 5 | 3 |
Other businesses | Runs a family catering business | Runs 9 shops under one master brand | N/A |
Organization Structure | Owner + Staff | Owner + Staff | Owner + Father + Brother + Manager |
Business Process |
|
|
|
Buying Behavior | Selective buyer; chooses tailored solutions that improve operational efficiency. | Practical buyer; looks for value-driven tools that reduce repetitive manual work. | Analytical buyer; data-focused & chooses logically over personal opinions |
Attitude towards product | Enthusiastic; appreciates the product's impact & brags about it. | Positive but practical; values products & refers the right ICP. | Loyal & satisfied; spends some exploring all the features. |
Engagement level | High; daily | High; daily | Moderate; not used when the business is run by family. |
Retention rate | High | High | High |
Features used | Receipts: Prints or shares online. |
|
|
Unused Key Features |
|
|
|
Usage Frequency |
|
|
|
Other Apps/Tools used at business |
|
| Excel: Tracks opening/closing balances. Since the owner's father can't use Zobaze POS, cash flow is tracked on Excel by the manager. Also used to track inventory orders users place and similar expenses. |
Social Media Apps Used |
|
|
|
Survey references


User segmentation - basis commitment
Fields | Casual | Core | Power |
|---|---|---|---|
Definition | User who has not fully utilized or understood the core value of our product. | Users who use our product often but with limited feature engagement. | Users who use our product almost daily & deeply (more features). |
Context in Zobaze | Small store owners or new users who only use basic features like receipts sporadically or only when a customer asks for. | Regular retail users who hire our product just for billing & inventory. | Long retained users who explored all the features & saw the value. |
Depth | Very Low | Moderate; doesn't use the app to the fullest. | High |
Frequency | 4 times a week | 5 times a week | Daily |
Breadth | Narrow; Uses inconsistently & only for billing | Moderate; Uses frequently but only for billing & Inventory | Wide; Explores all the primary features. |
Let's go deep..... | |||
Product awareness | Low; doesn't know basic features. | Moderate; doesn't fully understand the product's potential. | High; figures out easy ways for their daily operations. |
Commitment level & attitude towards the product | Low; not willing to spend time/money. | Moderate; spends money & time, but doesn't talk about the product unless asked. | High; feels it's worth the money spent & brags about it. |
Subscription status | Free. | Free or Paid. | Paid & usually annual subscribers. |
Retention rate | Very low; sometimes forget the product is installed on their mobile. | Moderate; has less loyalty & may switch to competitors. | High; point of no return. |
Challenges concerned to product usage | Lack of awareness. | Value communication not done right. | In need of new features. |
Alternate methods | Traditional methods. | A mix of traditional methods & Zobaze features. | Other tools for features that are absent. |
Let's turn all the stones....

Advanced Segmentation - basis RFM analysis
Note: To efficiently use RFM analysis for a product, it should ideally have a large dataset with at least 100 thousand users.

With the data we have, let's focus on the three core segments:
Refer to this article for more information on RFM analysis.
- Loyal Customers.
- At Risk Customers.
- Hibernating Customers.
Customer segment | Definition | Importance |
|---|---|---|
Loyal Customers | They are loyal, renews subscriptions, gives helpful feedback, refers others, helps the product grow. | They're the North star metric for understanding why & how they became loyal customers, helping to replicate the path for others. |
At Risk | Users who were active in the recent past & pulling back - drop in engagement frequency. | Always prioritize solving for users at this stage, for they experienced the core value of your product. |
Hibernating | Users who started using the product but dropped before e the experiencing the core value proposition. | Solving for them shows how well we're communicating the value of our product to the new users. |
Warning: Don't read the Whimsical now!!!


Before designing engagement campaigns, it is important to consider the following points;
- User segmentation: Who is our target audience?
- Problem statement: Why have we chosen them for this campaign?
- Reasons: What are the factors that make them a challenge for us?
- Goal of the campaign: What outcome are we expecting from this campaign?
- By: How will we execute this campaign?
- Channel: What channel will we use & why?
- Offer & Message: How will we encourage users to take actions they aren't currently doing?
- Timing: When is the right moment to pitch?
Now read the Whimsical for the answers to these questions.

Campaign Experiments
Note: Users selling on Facebook & Instagram may be relatively less. We're choosing In-app, WhatsApp, and Email.
Experiment 01
Feature introduced: Inventory management.
Audience: Casual users using only for billing.
Problem: Users engaging with only one of the key features.
Reason:
- Only billing is a free feature & inventory is paid.
- Unaware of the feature's potential.
Goal: Convert Casual users to Core by nudging them to use Inventory features.
Channel: WhatsApp.
Offer (discount): 25% on Monthly plan.
Timing: Very next day user makes a sale on our app, before they open it again.
Message:

Rationale:
- 25% is highlighted with a positive message about the previous day's sales, and hope is built for improvement.
- The importance of Inventory management feature is conveyed.
- What's included in the Premium is also communicated to create a sense of FOMO.
Metrics to track:
Pre-experiment - Baselines | Post-experiment - Changes |
|---|---|
User engagement - Time spent. | Campaign open rates. |
WhatsApp open rates for past campaigns. | Customer Support tickets. |
Returning users count. | Subscription status. |
Inventory management - feature adoption. | User Ratings. |
Total sales made. | Unsubscribed rates. |
Total sales made. | |
Engagement - Time spent on app. | |
Number of items added. | |
Returning users count. | |
Return On Investment - ROI. | |
Heatmaps; to understand how's the new feature understood. |
Experiment 02
Feature introduced: Staff management.
Audience: Core users having more than one business account.
Problem: Users engaging with only a few key features - billing & inventory.
Reason:
- Friction in purchasing Premium for different businesses.
- Unaware of the feature's potential.
Goal: To convert Core users to Power by deepening their engagement Breadth.
Channel: In-app.
Offer (credit): Buy one Get one free.
Timing: Every time user switches to another business account in the app.
Message:

Rationale:
- Content is personalized with user name & pain point.
- Offer is highlighted for the user to read the entire message.
- Aha moment - running business from anywhere - is communicated.
- Feature is introduced in brief for user awareness.
- Details of the offer are at last, post communicating the key contents.
Metrics to track:
Pre-experiment - Baselines. | Post-experiment - Changes. |
|---|---|
User engagement - Time spent. | Open rate/CTR |
In-app open rates/CTRs | Heatmaps; to understand user exploration after seeing the message. |
Returning users count. | Customer support tickets raised. |
Other features usage. | Subscription status of all businesses. |
Total sales made per business | User Ratings. |
Post conversion; Staff permissions given. | |
Staff count added. | |
Feature adoption. | |
Returning users count. | |
Engagement level | |
Total sales made per business |
Experiment 03
Feature introduced: Advanced Sales Reports.
Audience: Core users who frequently make sales.
Problem: Users engaging with only a few key features - billing & inventory.
Reason: Unaware of the feature's potential.
Goal: To convert Core users to Power by deepening their engagement Breadth.
Channel: Email.
Offer (value): Save 50% of your wastages.
Timing: Just before the user closes their store, the intent to know the sales made for the day is usually high.
Message:

Rationale:
- Business value & how the feature helps is communicated in the primary heading with a clear CTA.
- Sub features are introduced in a brief for users' awareness.
- Saving time & wastages is an AHA moment for our users.
Metrics to track:
Pre-experiment - Baselines. | Post-experiment - Changes. |
|---|---|
User engagement - Time spent. | Open/Read rate. |
Subscription status. | CTA click rate. |
Mail Open/Read rates. | Heatmaps; to understand user action after landing on reports page. |
Total sales made. | Customer support tickets raised. |
Subscription status. | |
User Ratings. | |
Post conversion; Reports checking frequency. | |
Email unsubscribed rate. | |
Email replies. | |
Returning users count. | |
Engagement level | |
Total sales made / items added. |
Experiment 04
Feature introduced: Staff management.
Audience: Core users having more than one business account.
Problem: Users engaging with only a few key features - billing & inventory.
Reason:
- Friction in purchasing Premium for different businesses.
- Unaware of the feature's potential.
Goal: To convert Core users to Power by deepening their engagement Breadth.
Channel: WhatsApp
Offer (credit): Buy one Get one free.
Timing: 08:00 AM, where our ICP usually checks WhatsApp with chai/coffee in one hand.
Message:

Rationale:
- Content is personalized with user name & pain point.
- Offer is highlighted for the user to read the entire message.
- Aha moment - running business from anywhere - is communicated.
- Details of the offer are at last, post communicating the key contents.
Metrics to track:
Pre-experiment - Baselines | Post-experiment - Changes |
|---|---|
User engagement - Time spent. | Campaign open rates. |
WhatsApp open rates for past campaigns. | Customer Support tickets. |
Returning users count. | Subscription status. |
Inventory management - feature adoption. | User Ratings. |
Total sales made per business. | Unsubscribed rates. |
Total sales made. | |
Engagement - Time spent on app. | |
Number of items added. | |
Returning users count. | |
Return On Investment - ROI. | |
Heatmaps; to understand how's the new feature understood. |
Experiment 05
Feature introduced: Advanced Sales Reports.
Audience: Casual users who only make sales.
Problem: Users engaging with only one key feature - billing.
Reason: Unaware of the feature's potential.
Goal: To convert Casual users to Core by deepening their engagement Breadth.
Channel: Push Notification.
Offer (value): Save 50% of your wastages.
Timing: Just before the user closes their store, the intent to know the sales made for the day is usually high.
Message:

Rationale:
- Right data & how the feature helps is communicated.
- Saving wastages is an AHA moment for our users.
- Urgency is created with content style (Hurry up & Stock Alert).
Pre-experiment - Baselines. | Post-experiment - Changes. |
|---|---|
User engagement - Time spent. | CTP rates. |
Subscription status. | Heatmaps; to understand user action after landing on reports page. |
Open rates. | Customer support tickets raised. |
CTR rates. | Subscription status. |
Total sales made. | User Ratings. |
Post conversion; Reports checking frequency. | |
Engagement level. | |
Returning users count. |
Let's delve into Active user retention
Considering our most purchased plan, monthly plan, we're using data from the last calendar year to analyze retention.


The retention curve flattens starting from Month 03, which suggests that our user base is reaching a stable level of engagement. By this point, most of the churn has already occurred, and the remaining users are engaging consistently.
Industry standards for B2B SaaS
B2B SaaS typically has better retention rates because businesses often rely on these solutions for critical operations, making them less likely to churn.

Reference link
Deep-dive into understanding Zobaze retention
To have a microscopic view of retention, we need to zoom in onto three things;
- Which ICPs drive best retention.
- What acquisition channels bring in users with higher retention, and
- Which sub-features contribute most to retention.
Let's look into data.........again.

ICPs driving best retention
Let's analyze the paying users based on key factors such as business type, country, age group, and the type of subscription they have chosen.
Key insights:
Business type: Categorizing paying users according to their industry.
Country: Understanding geographical distribution of paying users.
Age groups: Identifying the age demographics that are most likely to subscribe.
Subscription Type: Examining the preference for monthly vs. yearly plans.
Note: The insights below are based on original data collected directly from active users through user calls and surveys, for the accuracy of user behavior.


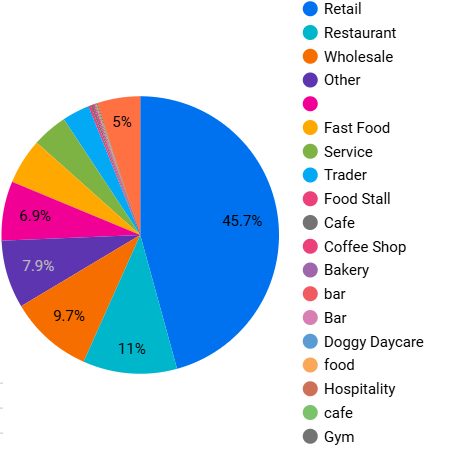


To put it briefly: Retailers in the Philippines, aged 25-35, with a staff count of 1 to 3, are opting for monthly plan. This is followed by retailers from India, Malaysia, Nigeria, and others.
Insight: Basis the Industry (Retail), age (25-35), & Staff count (1-3), we can design all our campaigns.
Acquisition channels driving the most retained users
Let's analyze the channels based on key factors such as installs, engagements, transactions made, and revenue generated.
Note: The insights below are based on original data collected from Google Analytics and Revenue forms.


The organic channel is clearly leading in driving the most installs, engagement, retention, and revenue. If we consider the user journey:
Users search for an application to solve their problem on PlayStore & Google browser. They explore various options, review features and user feedbacks, assess the product's potential, try it out, and then engage. Many of the users convert to paying customers and renew their subscriptions consistently.
Sub features contribute to most retention
A quick recap of what Zobaze does: Zobaze supports SME business owners in organizing their operations like: Inventory management, sales, tracking cash flows, staff management, receipt keeping, and so on.
Features:
- Inventory Management: Add inventory with pricing, plus get alerts for low and expiring stock.
- Sales Counter: A built-in counter for making sales, with receipt generation for print or sharing.
- Report Tracking: Detailed sales reports covering daily profits, expenses, top-selling stocks, staff, and customer activity.
- Staff Management: Add staff with role-based permissions, and manage attendance and payroll.
- Online Storefront: Users can sell online via a website created and hosted by Zobaze.
Among these features, key features that convey core value proposition is the Sales counter, which allows users to make sales using Zobaze POS app. So, which sub-features driving engagement that in-turn drive retention?

The sub features with the highest event count (most usage) are Reports & inventory management.
Reasons for Churn

As far Churn is concerned, what matters most is the users who've performed at least one core action in our product but are no longer doing so.
Our core action is using our app for making sales i.e., creating receipts, for which users must add items to their inventory. We've identified users who canceled their subscriptions but have over 10 inventory and generated more than 25 receipts. Below is a breakdown of the reasons for churn, categorized into voluntary and involuntary reasons.
Voluntary | Involuntary |
|---|---|
Lack of value; In paid plan over free. | Business closed. |
Pricing issues; looking for discounts. | Payment failures; technical reasons or bank balance. |
Poor User Experience; App crashes or bugs during the time of key operations. | Subscription renewals; CS team manual intervention to renew subscriptions. |
Unaware of USP over competitors; moving to affordable competitors with limited features. | |
Customer Support problems. | |
Seasonal users; have desktop POS & requires a Mobile POS only during festivals. | |
Unaware of product's potential or features. | |
Lack of features meeting new business goals. |
Note: We can only solve for Voluntary reasons, for involuntary reasons are out of our control.
Wondering why voluntary cancellation reasons are more in number than involuntary ones? I was also puzzled by the same question, and the data that helped answer it is provided below.

What's the silver lining? Voluntary churn is something within our control and can be addressed, unlike involuntary churn. With an optimized retention strategy, this issue can be solved.
Negative actions
Long & boring content??? A short story just for you..
You fell for someone and started chatting or calling them daily to impress, roaming around their house just to catch a glimpse, following them, and planning to celebrate their birthdays. One day, they accepted, and you stopped all your efforts. Before you even realize it, the other person begins to notice this shift and starts complaining - and this, my friend, is dangerous.. even lethal.
These are Negative actions - behaviors that our users were actively engaged in before, but have started moving back.
For a B2B SaaS business like Zobaze, Negative actions would be;
Negative actions | Description |
|---|---|
Reduced key feature usage | Highlights the user moving away from core value prop |
Reduced session times | Shows user interest in exploring features |
Downgrading plans | Not seeing value in premium plans |
Ignoring app updates | Highlights stagnation |
Reduced frequency | Signals potential disengagement |
Negative support interactions | Shows users dissatisfaction |
Not renewing plan actively | Indicates users might be exploring other options |
Negative customer reviews | Shows users dissatisfaction |
Subscription cancellations | Final red flag |
Out Of Context; Our primary challenge is in retaining New Users - which will be solved by Onboarding.

Let's explore some industry standards. Reference link
 Evidence

Before designing any resurrection campaigns, it is important to understand whom we targeting and validate the approach using Opportunity vs. Risk framework. This is crucial because we are dealing with users who have left us and are most likely dissatisfied, making them more susceptible to being offended and acting against us.
Let's note down top 5 reasons for Voluntary churn:
- Lack of value; In paid plan over free.
- Pricing issues; looking for discounts.
- Poor User Experience; App crashes & bugs during the time of Key operations.
- Unaware of USP over competitors; moving to affordable competitors with limited features.
- Unaware of product's potential & features.
Campaign | Hypothesis | Channel of Distribution | Theme | Target feature | Goal of campaign | Offer | Message | Timing | Success Metrics |
|---|---|---|---|---|---|---|---|---|---|
Campaign 1 | Users churned due to lack of perceived value in Paid plans over Free plan. | In-app; For users using in free mode. | Demonstrating what is missed in Free over Paid | Reports; which gives visibility on ROI. | Reinforce the value of paid plans vs. free. | Access to exclusive features for one month. | Hey business owner, Did you know how much stock got wasted last month? Use your business reports to make informed decisions - Totally free for one month, just for you! | Just before closing hours of the shop, where users review sales made & track stock for placing new orders. | Conversion rate from Free to Paid. |
Campaign 2 | Users churned due to pricing issues and looking for discounts. | WhatsApp; for more flexibility | Promoting offers/discounts. | Inventory management; most used feature by others. | Win-back users by offering competitive pricing. | Add 25 items to get 25% off; active users add at least 20 items on day 01. | Premium at all time cheapest! Add 25 items & unlock 25% off Premium!! | Morning 8 AM; where our ICP usually check WhatsApp sipping on tea/coffee. | Discount redemption rate. |
Campaign 3 | Users churned due to App crashes & bugs hindering their daily operations. | Promotional content on PlayStore. | Nudging users to update. | Sales counter; daily operations. | Regain trust & make users update. | Extended free trial; giving them time to test the update. | Your store has got a new update! Reported error free by 10K+ business. | Weekends; where we usually get more acquisitions. This says, users are exploring PlayStore on weekends to try out new apps. | App updates, free trial activations, & crash reduction rate. |
Campaign 4 | Users churned due to app's USP over affordable competitors. | Email. | Highlight key differentiations. | Ease of Use in Billing. | Showcase Zobaze's advantage over others. | Buy 2 Get 2 free; Renew 2 subscriptions on time, get 2 more subscriptions free. | Two months Premium free!! Have you tried our POS billing? Print receipts that speak for your brand & stand out among competitors. Renew your next two subscriptions on time; get 2 months Premium free. | 11 AM; where our ICP opens the store, finishes daily rituals, & settles in before customers start flowing in. | Increased feature usage. |
Campaign 5 | Users were unaware of product's full potential and features. | Push Notifications; introducing right feature at the right time. | Product discovery & education. | Advanced Reports; Stock, Sales, Profits.. | Convey the potential features that give AHA moment. | 14 days free trial of advanced features. | Message: Bread packets left : 05. Hurry up & re-stock! You sell 100 Bread packets a day.
Use Premium features totally free with a trial. No card details needed. | Depends on stock levels.. | Free trial activations. |
Opportunity vs. Risk analysis
Opportunities | Risks |
|---|---|
User Re-engagement; bringing back users who previously found value in our product. | Unsubscribed rates may increase; as they are already dissatisfied users. |
Improved Retention; By addressing reasons for churn brand loyalty increases. | Time/effort; campaigns cost us a lot without guaranteed success. |
Revenue increases. | User frustration; churned users are more likely to get frustrated when approached. |
Positive user reviews; once users are sticked back. | Negative reviews. |
Reduced cost of acquisitions; cheaper to win back users who already seen the value. | Misaligned campaigns; if the content doesn't align this may result in further churn - sensitive. |
Opportunity for up-selling; with new features being promoted. |
Only 15% of the Resurrection campaigns turns out to be impactful
Before planning any Resurrection campaign, it's essential to conduct an Opportunity vs. Risk analysis to prevent exacerbating the issue.
Campaign visuals
Note: The success metric, other metrics to track, and detail campaign details are mentioned in the table & the opportunity vs. risk analysis above. Below are only the visual representations of the campaigns.
Campaign 01
Feature introduced: Reports.
Channel: In-app.
Offer (credit): Free access to Premium feature for one month
Message:

Campaign 02
Feature introduced: Inventory.
Channel: WhatsApp.
Offer (credit): 25% off on Premium plan.
Message:

Campaign 03
Feature introduced: Update available
Channel: PlayStore - Promotional Content
Offer (credit): Free Trial extended.
Message:


Campaign 04
Feature introduced: POS Billing.
Channel: Email.
Offer (credit): Buy Two Get Two Free.
Message:

Campaign 05
Feature introduced: Inventory Reports.
Channel: PlayStore - Push Notification.
Offer (credit): Free Trial of the feature.
Message:

Finally the project is done & dusted!!!!!!


Brand focused courses
Great brands aren't built on clicks. They're built on trust. Craft narratives that resonate, campaigns that stand out, and brands that last.


All courses
Master every lever of growth — from acquisition to retention, data to events. Pick a course, go deep, and apply it to your business right away.


Explore courses by GrowthX
Built by Leaders From Amazon, CRED, Zepto, Hindustan Unilever, Flipkart, paytm & more
Course
Advanced Growth Strategy
Core principles to distribution, user onboarding, retention & monetisation.
58 modules
21 hours
Course
Go to Market
Learn to implement lean, balanced & all out GTM strategies while getting stakeholder buy-in.
17 modules
1 hour
Course
Brand Led Growth
Design your brand wedge & implement it across every customer touchpoint.
15 modules
2 hours
Course
Event Led Growth
Design an end to end strategy to create events that drive revenue growth.
48 modules
1 hour
Course
Growth Model Design
Learn how to break down your North Star metric into actionable input levers and prioritise them.
9 modules
1 hour
Course
Building Growth Teams
Learn how to design your team blueprint, attract, hire & retain great talent
24 modules
1 hour
Course
Data Led Growth
Learn the science of RCA & experimentation design to drive real revenue impact.
12 modules
2 hours
Course
Email marketing
Learn how to set up email as a channel and build the 0 → 1 strategy for email marketing
12 modules
1 hour
Course
Partnership Led Growth
Design product integrations & channel partnerships to drive revenue impact.
27 modules
1 hour
Course
Tech for Growth
Learn to ship better products with engineering & take informed trade-offs.
14 modules
2 hours
Crack a new job or a promotion with ELEVATE
Designed for mid-senior & leadership roles across growth, product, marketing, strategy & business


Learning Resources
Browse 500+ case studies, articles & resources the learning resources that you won't find on the internet.

Patience—you’re about to be impressed.